Whitepaper Review: How Shazam Works - Part 2
In part 1 of this review I discussed Shazam’s method of creating a unique fingerprint for a song. In this part I am going to discuss how Shazam uses these fingerprints to efficiently identify a song from a partial recording.
Searching for Fingerprint Matches
The power of Shazam comes from its near instant method of identifying a song. So far we’ve seen how Shazam creates a unique fingerprint for a song but not how it manages to find the matching song so quickly.
Naive approach
The most simple approach to find a match is to take the filtered spectrogram of a portion of a potential song and look for matching fingerprints in all other songs.
For each song fingerprint in the database, you will have to slide the fingerprint of the recorded clip over each recording length window of the entire song and look for a match in the peak frequencies.
Let’s say we record a 10-second clip of a song, there are on average 3 features per 0.1 seconds for a total of 10/0.1 x 3 = 300 features in the 10 second clip. Each segment of a song compared is (300 x 300) = 90,000 read operations to compare all values. Then if a song is on average 180 seconds long, it would take (180/10) * 90,000 = 1.6 million operations just to search a single song.
Hashes to the rescue
Rather than brute forcing a search for the perfect partial fingerprint match across every song in the database, we could use hash tables. A hash table is a data structure that stores data in key-value pairs. Keys can be queried in near real-time unlike in an array where in the worst case scenario you have to search through every element in the array to find a matching element.
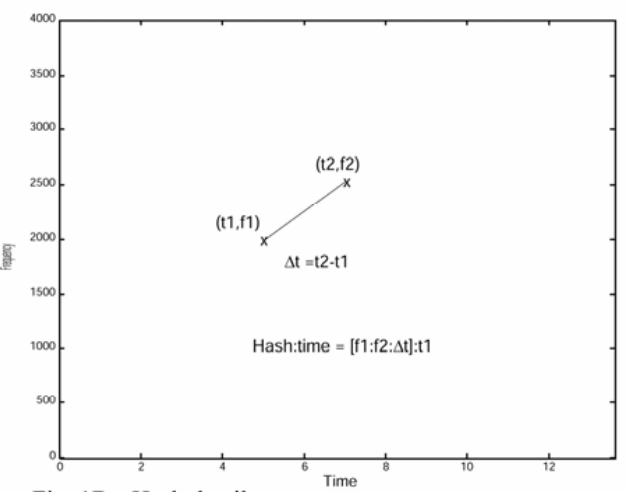
Shazam make very clever use of a hash table by creating a relatively unique hash for each point in the spectrogram that consists of:
["point frequency", "anchor point frequency", "time difference between anchor and point"]

Fig 1 above shows the hash creation for a single point in the filtered spectrogram. This is done for every peak in the filtered spectrogram of which there are typically hundreds of peaks.
This hash is then encoded in a 32-bit integer with:
- 9 bits for the frequency of the spectrogram peak
- 9 bits for the frequency of the anchor point
- 14 bits for the delta in time between the anchor and peak
I will talk more about the anchor point and what it is in the next section of the article but for now we’ll just accept that it is itself a peak in the spectrogram that is selected in some way and used as a reference point for making the hash more unique to the song.
Now a hash can be created for every point in the 10-second recording along with the chosen anchor point and time delta between the points and can be queried to find all other songs that contain the same feature. It is rarely only one song that matches but it greatly reduces the list of potential matching songs.
More about that anchor point
So far we’ve just accepted that there’s some anchor point that is used to calculate the hash but I haven’t yet mentioned how that anchor point is chosen.
In order to understand how the anchor point is chosen for each peak in the spectrogram, we have to understand the concept of target zones. Target zones were coined in the white paper and they are simply a method of splitting the filtered spectrogram into overlapping groups of peaks.
Inconveniently, the whitepaper does not discuss how peaks are grouped into target zones so I’m just going to make up some way for the sake of understanding the concept. Let’s also say for this example that we create target zones of 10 peaks.

-
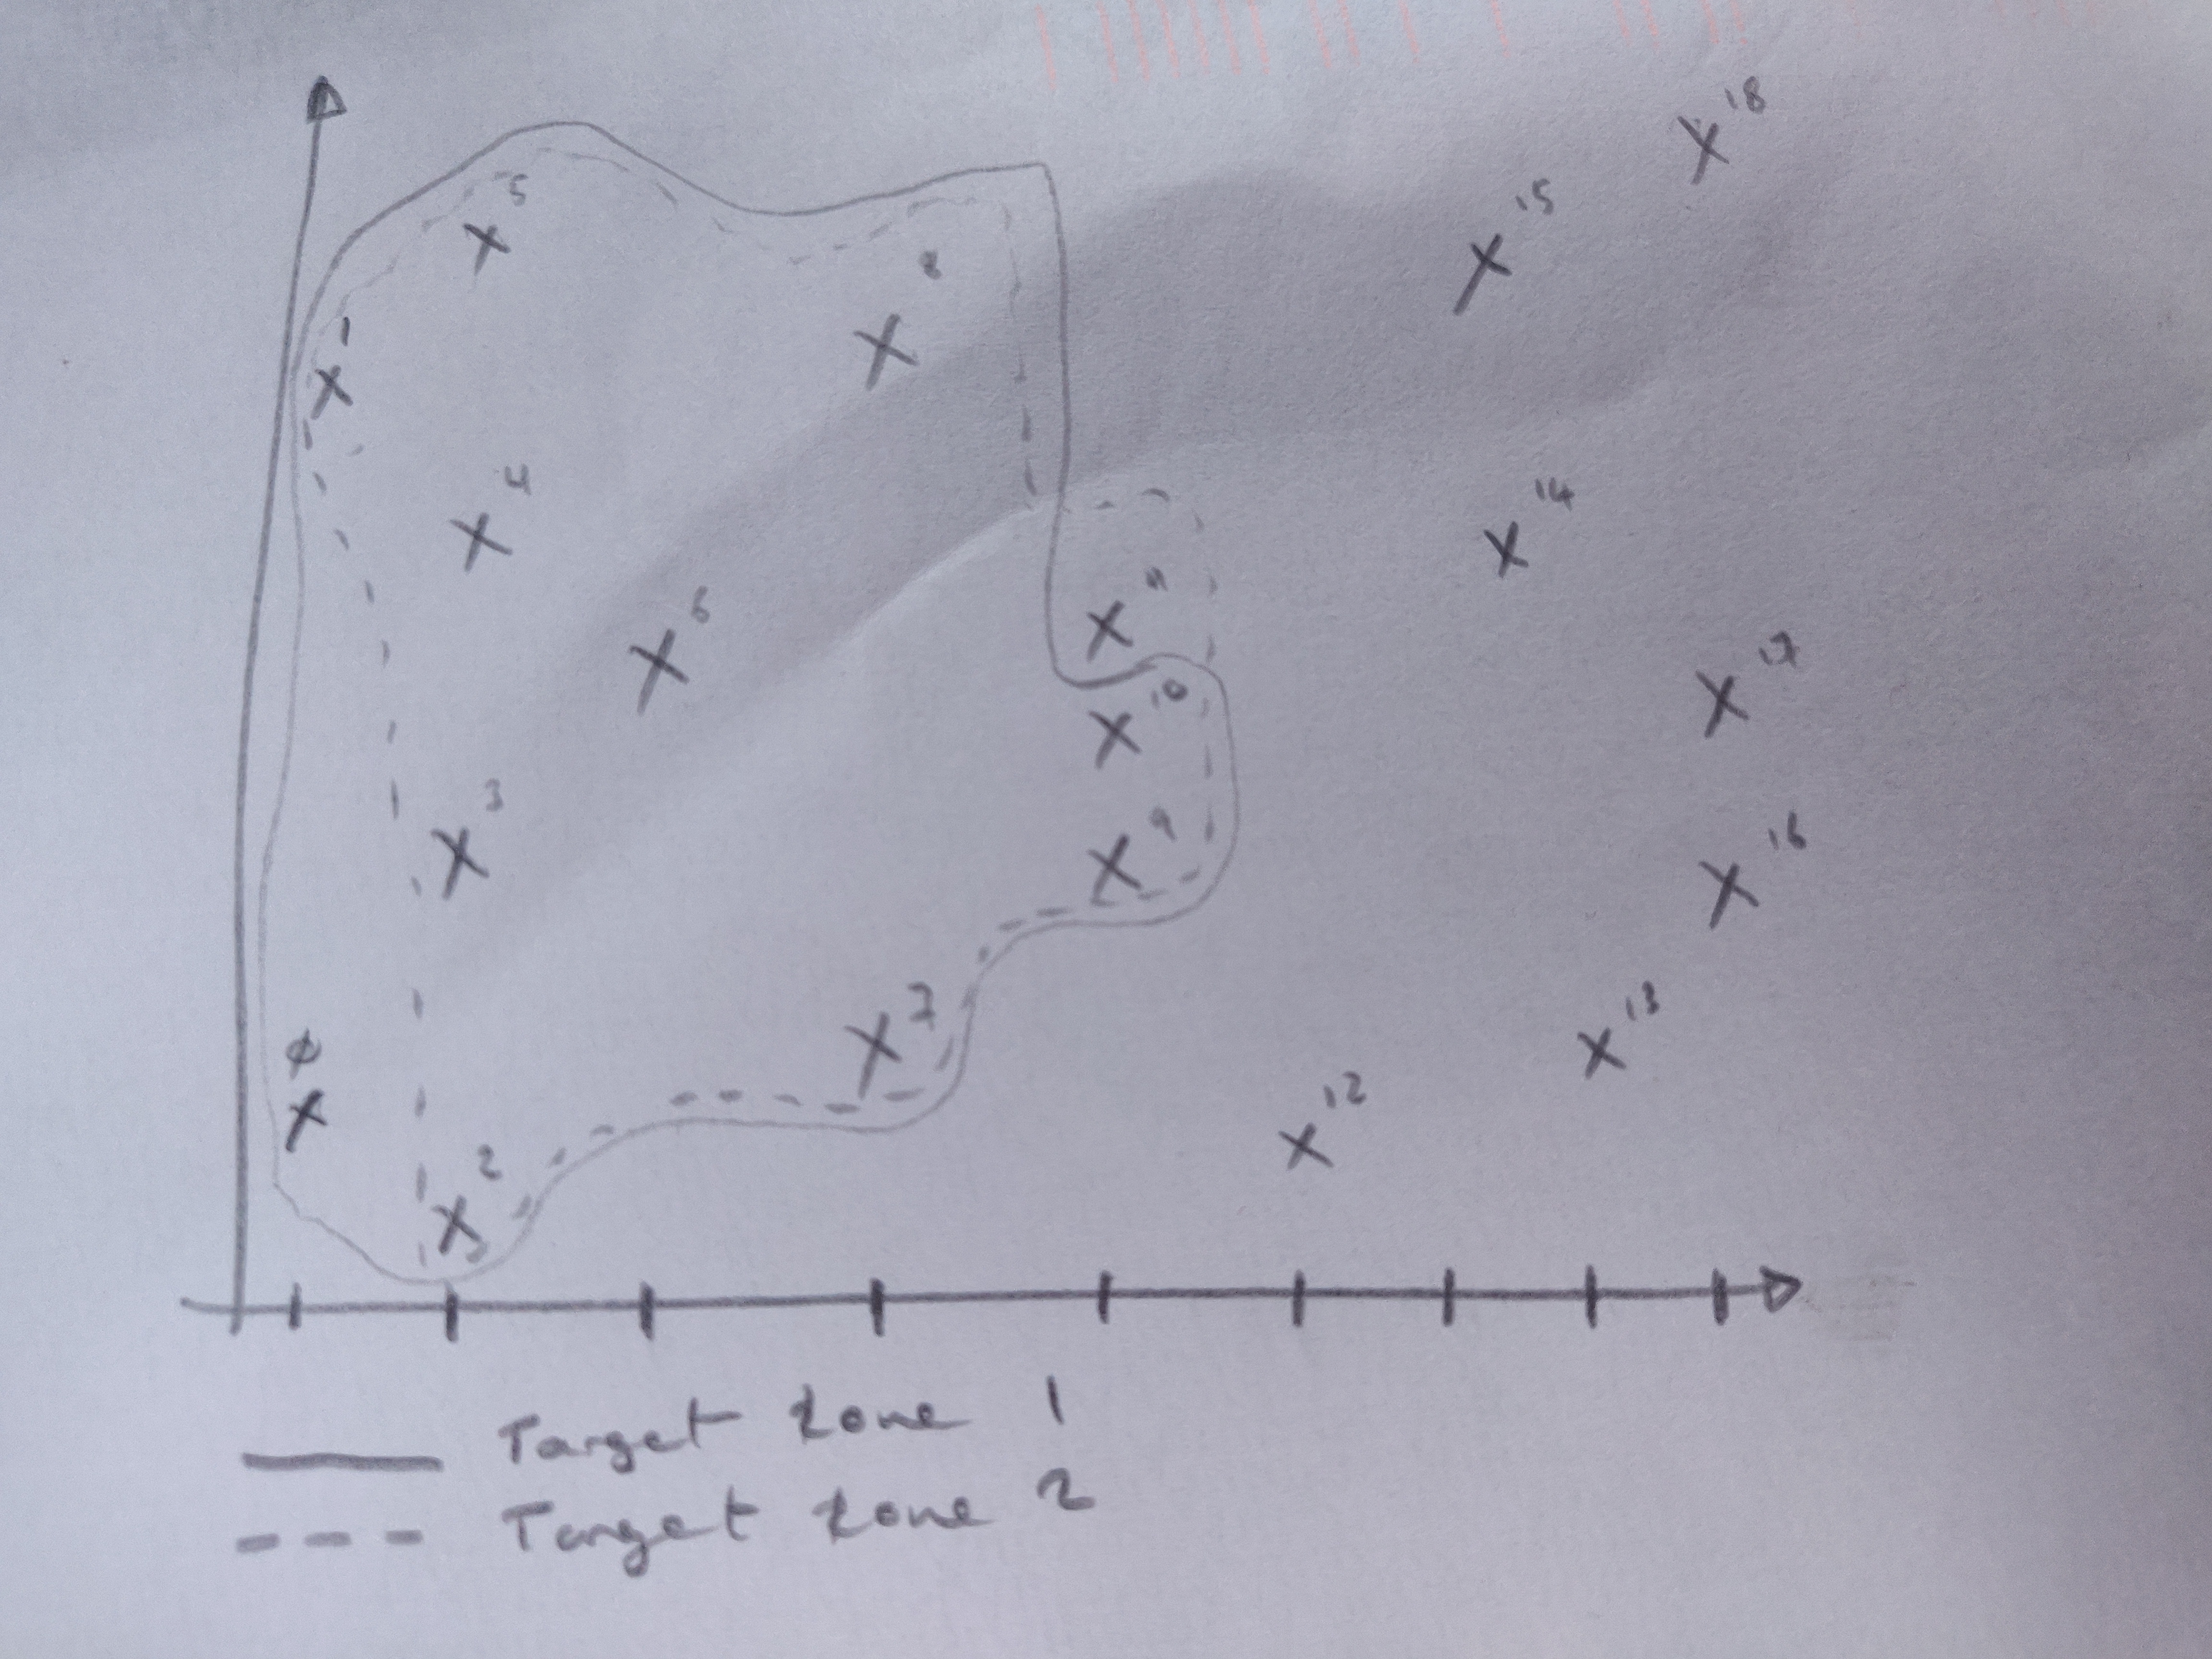
Label each peak in the filtered spectrogram with an increasing number. Label from the first FFT in the spectrogram to the last, and from the lowest to the highest frequency in each FFT as seen in Fig 2 above.
-
Split the peaks into overlapping target zones with 10 peaks in each by the labels. For example:
- Target zone 1: peaks 0 - 10
- Target zone 2: peaks 1 - 11
- Target zone 3: peaks 2 - 12
- Target zone n: peaks (n-10) - n
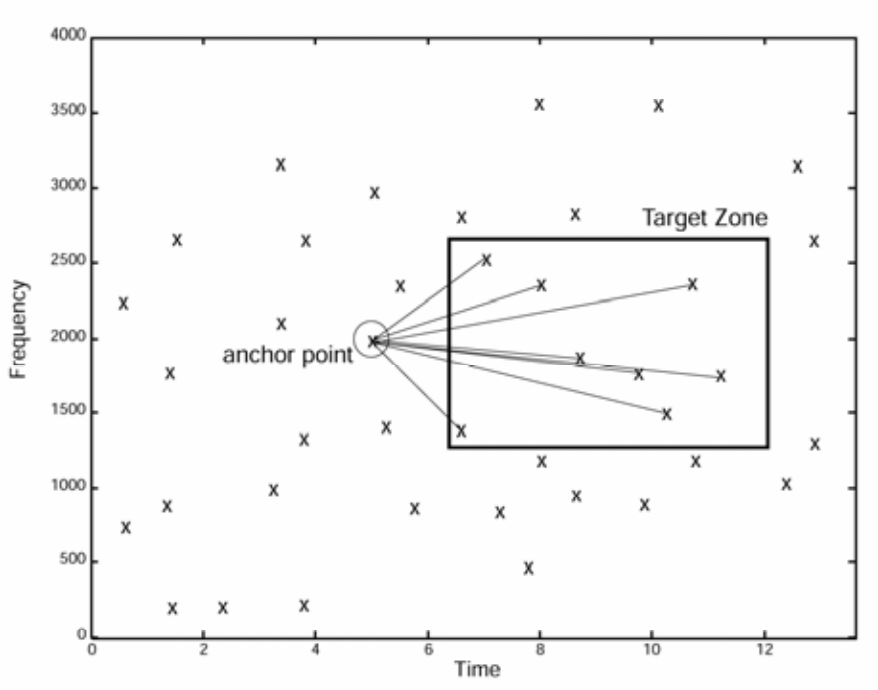
Why are we creating these target zones? Because we’re going to select an anchor point for each target zone and use it with every point in the target zone to create our hashes to search for in the Shazam database.
So how is the anchor point for each target zone selected? Again, it is inconveniently ommitted from the whitepaper. However, I don’t think it really matters as long as it can be reproducible. Let’s say that it is the peak that is 5 peaks away from the first peak in the target zone.

In Fig 3 above, if you count 5 peaks from the first peak within the bounding box of the target zone, it should be the point marked as the anchor point in the diagram.
So how many hashes does a 10-second audio clip create? Because the target zones are overlapping, we have 300-1 or 299 target zones each with 10 points. This results in 299x5=1495 hashes to be queried for matching songs.
Filtering the search results
Now that we have a list of potential songs that could match, we have to narrow it down to just one song.
How do we do that? Well this is actually not mentioned at all in the whitepaper but we’ll give it our best shot anyway.
We can find how many target zones a song has in common with the recorded 10-second clip. If all of the hashes in a target zone match a song, we consider that a target zone match. If our 10-second recording has 299 target zones, we can remove any songs that don’t have at least 300 target zones, or close to that, in common with the recording.
Then we compare the filtered songs for time coherency that everything matches up and the song with the most number of time coherent peaks is our winner.
Conclusion
There’s a lot to take in with this algorithm and a lot to be left to the imagination because of a vague whitepaper. However, I believe that this technique can be adopted and used for a bunch of really interesting applications.
It appears to me that there is some but not a lot of research into the method and its applications so there’s definitely some research opportunity to adopt and improve the technique.
References
[1] Shazam’s Whitepaper: https://www.ee.columbia.edu/~dpwe/pubs/OgleE07-pershash.pdf
